Image Details
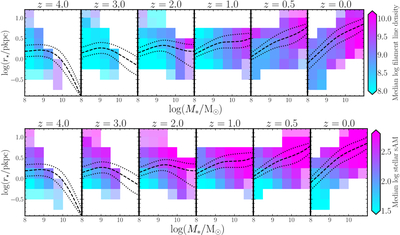
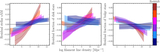
Caption: Figure 9.
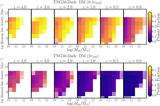
Galaxies in stellar mass-size space at different redshifts, colored by the median nearest filament density (top row) and the median stellar sAM (bottom row). The dashed and dotted curves correspond to the median relationship and 25th and 75th percentiles, respectively. More extended galaxies typically have higher spin and at z ≥ 0.5 live in higher-density filaments.
Other Images in This Article
Show More
Copyright and Terms & Conditions
© 2026. The Author(s). Published by the American Astronomical Society.
Copyright ©
2026 Astronomy Image Explorer. All Rights Reserved.