Image Details
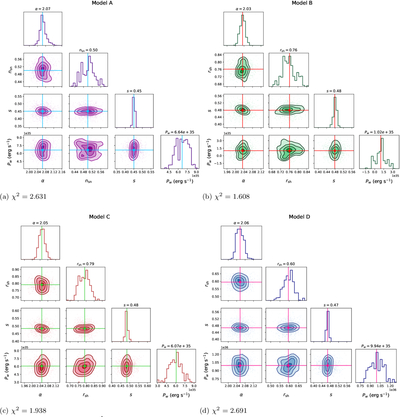
Caption: Figure 8.
Corner plots for Models A–D showing the local exploration of parameter space around the best-fit values, weighted by the χ 2 difference. The diagonal panels display 1D posteriors; vertical lines mark the median and the central 68% confidence interval. The off-diagonal panels show joint posteriors with contours at 68% and 95% credibility. Parameters include the wind power P w (in erg s−1), the transport index s, the characteristic shock radius r sh (in pc), the source index α, and, for Model A only, the supernova proximity factor ﹩{n}_{\mathrm{sn}}﹩. The numerical values printed in each panel correspond to the marginalized medians, and the number ﹩{\chi }_{\nu }^{2}﹩ beneath each set summarizes the fit quality for the corresponding model. Angular weights are not shown in this corner plot for clarity; they are presented in Table 3 and discussed in Section 3.2.
Other Images in This Article
Copyright and Terms & Conditions
© 2026. The Author(s). Published by the American Astronomical Society.