Image Details
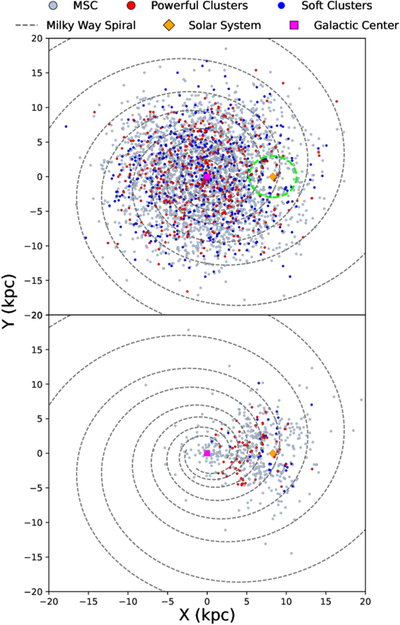
Caption: Figure 2.
Spatial distribution of MSCs in the Galactic plane. Top panel: combined sample that includes the simulated population and the observed objects, projected onto the X-Y plane. The green circle marks the sources inside a radius of 3.0 kpc from the Sun as listed by N. V. Kharchenko et al. (2013). Bottom panel: the observational catalog alone with the same projection. Gray curves indicate the spiral pattern adopted for visual reference.
Other Images in This Article
Copyright and Terms & Conditions
© 2026. The Author(s). Published by the American Astronomical Society.
Copyright ©
2026 Astronomy Image Explorer. All Rights Reserved.