Image Details
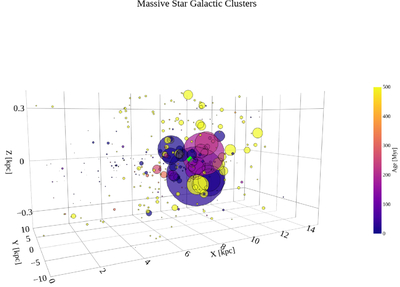
Caption: Figure 1.
The 3D distribution of the selected MSCs from the N. V. Kharchenko et al. (2013) catalog in Sun-centered Cartesian coordinates (X, Y, Z in kpc). Marker color encodes the cluster age, and larger markers indicate higher estimated cluster mass M cl (selection requires M cl > 103 M ⊙); the concentration near Z ≃ 0 traces the Galactic midplane.
Other Images in This Article
Copyright and Terms & Conditions
© 2026. The Author(s). Published by the American Astronomical Society.
Copyright ©
2026 Astronomy Image Explorer. All Rights Reserved.