Image Details
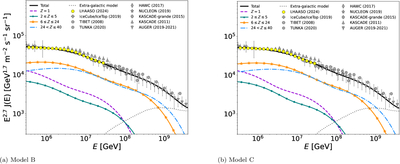
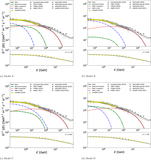
Caption: Figure 5.
Spectral composition for Models B and C. Each panel shows the total all-particle energy flux, along with the contributions from four charge groups: protons (Z = 1), light nuclei (2 ≤ Z ≤ 5), intermediate nuclei (6 ≤ Z ≤ 24), and heavy nuclei (24 < Z ≤ 40). Solid curves give the model prediction for each group and their sum. Extragalactic component (gray dotted line) from S. Thoudam et al. (2016; EG-RSB93), consisting of pure protons with an E −2 injection spectrum and an exponential cutoff at 1011 GeV. Data are from LHAASO (Z. Cao et al. 2024), the Pierre Auger Observatory (V. Verzi 2019; P. Abreu et al. 2021), KASCADE-Grande (M. Bertaina et al. 2015), IceCube/IceTop (M. G. Aartsen et al. 2019), Tibet ASγ (M. G. Aartsen et al. 2019), Tunka (N. M. Budnev et al. 2020), HAWC (R. Alfaro et al. 2017), NUCLEON (R. Alfaro et al. 2017), and KASCADE (C. Evoli 2020). Model definitions and parameters are given in Sections 3.2–3.1.2 and Tables 1–3.
Other Images in This Article
Copyright and Terms & Conditions
© 2026. The Author(s). Published by the American Astronomical Society.