Image Details
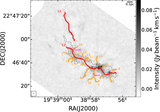
Caption: Figure 3.
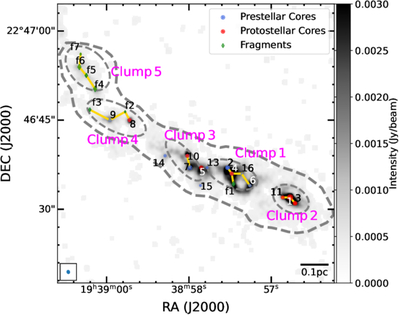
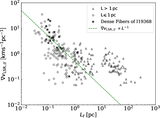
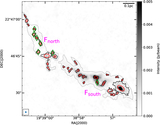
Spatial distribution of compact cores/fragments in I19368. The background is ALMA 1.3 mm continuum emission. The gray dashed contour and ellipses indicate the boundary of the major filament, and the clumps, respectively, derived from the SMA 1.3 mm continuum observations (X. Lu et al. 2018). The blue/red dots represent the prestellar/protostellar cores, and the green diamonds show the fragments, with the size of these symbols proportional to their associated mass. The yellow solid lines denote the spacing between neighboring cores/fragments within each clump generated by the MST algorithm. The synthesized beam of 0﹩\mathop{.}\limits^{\unicode{x02033}}﹩68 × 0﹩\mathop{.}\limits^{\unicode{x02033}}﹩58 and a scale bar of 0.1 pc are shown in the lower left corner and lower right corner, respectively.
Other Images in This Article
Copyright and Terms & Conditions
© 2026. The Author(s). Published by the American Astronomical Society.