Image Details
Caption: Figure 8.
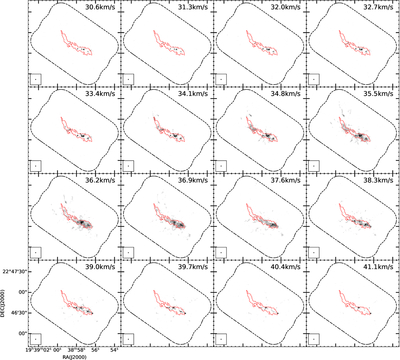
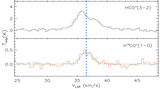
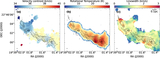
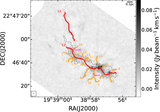
Velocity channel maps of the H2CO 3(0, 3)−2(0, 2) line emission above 3 rms (rms ∼ 1.53 Jy beam−1 m s−1) toward the I19368 region. The red dashed contours in each box are the same as in Figure 2, depicting the filament morphology. The corresponding LSR velocity of each channel map is displayed in the top right of each panel. The synthesized beam of 0﹩\mathop{.}\limits^{\unicode{x02033}}﹩80 × 0﹩\mathop{.}\limits^{\unicode{x02033}}﹩67 is shown in the lower left corner of each panel.
Other Images in This Article
Copyright and Terms & Conditions
© 2026. The Author(s). Published by the American Astronomical Society.
Copyright ©
2026 Astronomy Image Explorer. All Rights Reserved.