Image Details
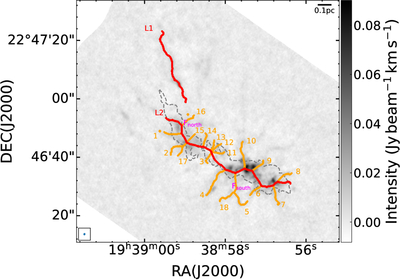
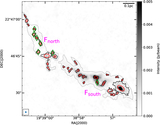
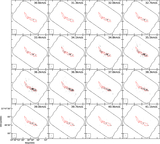
Caption: Figure 9.
Results of identified filamentary skeletons for the I19368 region. The background shows the integrated intensity map of H2CO 3(0, 3)−2(0, 2) line for the velocity channel centered at 35.5 km s−1. The dashed contour outlining the northern and the southern filamentary segments is the same as in Figure 2. The red skeletons show the 2 long filamentary structures (L1 and L2), and the orange branches indicate the 18 dense striations tagged 1−18. The synthesized beam of 0﹩\mathop{.}\limits^{\unicode{x02033}}﹩80 × 0﹩\mathop{.}\limits^{\unicode{x02033}}﹩67 and a 0.1 pc scale bar are located in the lower left and the upper right corners, respectively.
Other Images in This Article
Copyright and Terms & Conditions
© 2026. The Author(s). Published by the American Astronomical Society.