Image Details
Caption: Figure 1.
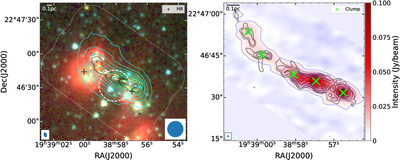
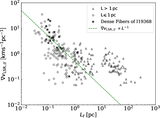
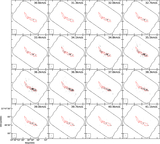
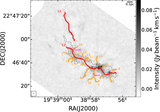
Left: three-color composite image of Spitzer 8.0 μm (red), 4.5 μm (green), and 3.6 μm (blue) emissions toward the I19368 region. The white dashed loop depicts the ALMA 1.3 mm mosaic field for I19368. The cyan contours show SCUBA-2 850 μm cold dust continuum emission, starting from 8σSCUBA-2 in steps of 5σSCUBA-2, with σSCUBA-2 ∼ 26.40 mJy beam−1 (D. J. Eden et al. 2017). The dashed circle shows the clumpy cloud structure observed from the SMT single-point observation (H. Yoo et al. 2018). The black contours show the 1.3 mm dust continuum emission observed with the SMA, starting from 5σSMA in steps of 10σSMA, with σSMA ∼ 1.0 mJy beam−1 (X. Lu et al. 2018). The black crosses show the locations of the H II regions, with the northern one classified as classical (L. D. Anderson et al. 2014) and the southern one as compact (L. Bronfman et al. 1996). The synthesized beam sizes are 4﹩\mathop{.}\limits^{\unicode{x02033}}﹩4 × 2﹩\mathop{.}\limits^{\unicode{x02033}}﹩8 for the SMA observation and 14﹩\mathop{.}\limits^{\unicode{x02033}}﹩4 × 14﹩\mathop{.}\limits^{\unicode{x02033}}﹩4 for the SCUBA-2 observation, which are shown in the lower left and lower right corners. A 0.1 pc scale bar is shown in the upper left corner. Right: SMA 1.3 mm continuum map of I19368. The blue contours are the same as the black contours in the left panel. The black contours show the ALMA 1.3 mm continuum emission, which is [3, 5, 10, 20, 40, 80, 160] × σrms(σrms = 0.10 mJy beam−1). The “×” indicates the locations of clumps observed by SMA. The synthesized beam sizes are 0﹩\mathop{.}\limits^{\unicode{x02033}}﹩68 × 0﹩\mathop{.}\limits^{\unicode{x02033}}﹩58 for the ALMA observation, which is shown in the lower left corner, and a 0.1 pc scale bar is shown in the upper left corner.
Other Images in This Article
Copyright and Terms & Conditions
© 2026. The Author(s). Published by the American Astronomical Society.