Image Details
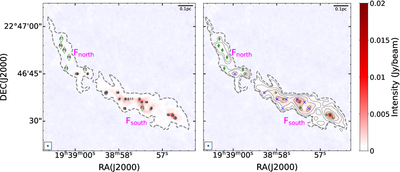
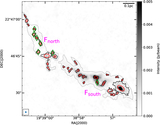
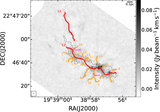
Caption: Figure 2.
ALMA 1.3 mm continuum map of I19368. The dashed gray contours delineate the boundaries of the southern filament region and the northern filament region. Left: 15 dense cores are marked with ellipses. Seven fragments (frags 1–7) are indicated with unfilled diamonds. Right: The solid black contours are [3, 5, 10, 20, 40, 80, 160] × σrms (σrms = 0.10 mJy beam−1). Green stars and blue crosses represent the protostellar and prestellar cores, respectively. The green diamonds indicate seven fragments same as the left panel. The synthesized beam and a 0.1 pc scale bar are shown in the lower left and the upper right corners, respectively.
Other Images in This Article
Copyright and Terms & Conditions
© 2026. The Author(s). Published by the American Astronomical Society.