Image Details
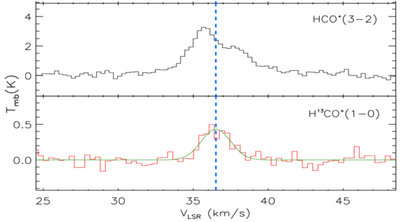
Caption: Figure 4.
Observed molecular line spectra of the clumpy cloud in I19368. The histogram shows the HCO+(3−2) line (upper panel) and the H13CO+(1−0) line (lower panel). The Gaussian fitting for the H13CO+(1−0) line gives the systematic velocity (the vertical blue dashed line) of this source. This figure was adapted from H. Yoo et al. (2018).
Other Images in This Article
Copyright and Terms & Conditions
© 2026. The Author(s). Published by the American Astronomical Society.
Copyright ©
2026 Astronomy Image Explorer. All Rights Reserved.