Image Details
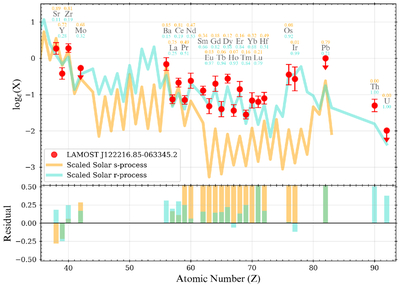
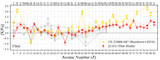
Caption: Figure 5.
Upper panel: abundance ratios ([X/Fe]) of J1222 for heavier elements (Z ≥ 35) as a function of atomic number (Z). The red dots represent the measured abundances with their uncertainties (see Table 2). The orange line shows the scaled-solar s-process pattern, normalized to the Ba abundance of J1222, while the cyan line represents the scaled-solar r-process pattern, normalized to the Eu abundance of J1222. The solar reference values are taken from M. Asplund et al. (2009), and the s- and r-process contributions for each element are based on Table 5 from D. L. Burris et al. (2000). The numbers around each element symbol are the production fraction of s- (orange) and r-process (green) from D. L. Burris et al. (2000). Lower panel: residuals between the observed abundances of J1222 and the scaled-solar s- and r-process patterns ([X/Fe] − [X/Fe]s or [X/Fe] − [X/Fe]r).
Other Images in This Article
Copyright and Terms & Conditions
© 2026. The Author(s). Published by the American Astronomical Society.