Image Details
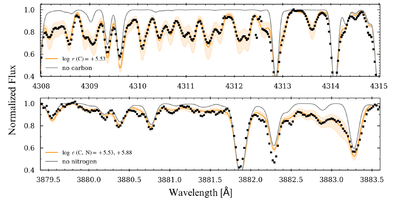
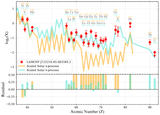
Caption: Figure 3.
Observed spectrum (black dots) and synthetic spectra in the CH G band near 4308–4315 Å (top panel) and the CN band around 3879.5–3883.5 Å (bottom panel). The orange lines represent the best-fit synthetic spectrum with carbon (﹩\mathrm{log}\epsilon ﹩ (C) = +5.53; top) and the combined carbon and nitrogen abundances (﹩\mathrm{log}\epsilon ﹩ (C, N) = +5.53, +5.88; bottom). In contrast, the gray lines show models without carbon or nitrogen. The orange shaded region represents the uncertainty in the synthetic models, ±0.2 dex.
Other Images in This Article
Copyright and Terms & Conditions
© 2026. The Author(s). Published by the American Astronomical Society.
Copyright ©
2026 Astronomy Image Explorer. All Rights Reserved.