Image Details
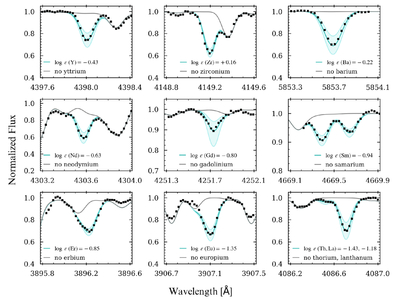
Caption: Figure 4.
SYN results derived for J1222 for important neutron-capture elements, from left to right and top to bottom, for Y, Zr, Ba, Nd, Gd, Sm, Er, Eu, La, and Th. Each panel shows the observed spectrum (black squares), the best-fit model (cyan), and the no-abundance model (gray). The cyan shaded regions represent the uncertainties (±0.2 dex) in the synthetic fits.
Other Images in This Article
Copyright and Terms & Conditions
© 2026. The Author(s). Published by the American Astronomical Society.
Copyright ©
2026 Astronomy Image Explorer. All Rights Reserved.