Image Details
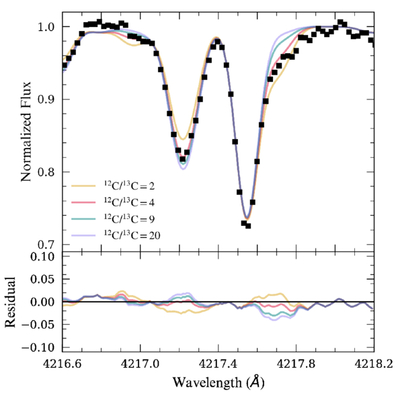
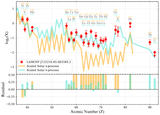
Caption: Figure 2.
Top panel: determination of the carbon isotope ratio (12C/13C) for J1222. The black squares are the observed spectrum, and the red solid line is the best-matched synthetic spectrum. The other colored solid lines show various spectral fits of 12C/13C = 2, 4, 9, and 20. Bottom panel: residual plot of the top panel.
Other Images in This Article
Copyright and Terms & Conditions
© 2026. The Author(s). Published by the American Astronomical Society.
Copyright ©
2026 Astronomy Image Explorer. All Rights Reserved.