Image Details
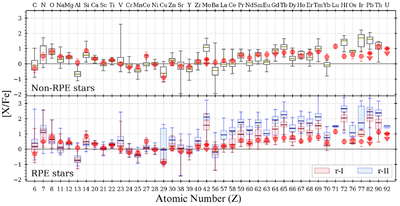
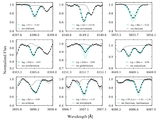
Caption: Figure 7.
Box plot comparison of the elemental abundances ([X/Fe]) of the J1222 and 514 non-RPE and RPE stars in the metallicity range –4.0 < [Fe/H] < –1.0 from the SAGA database. The boxes indicate the 25th–75th percentiles of the abundance distribution, and the whiskers represent the 1st–99th percentiles. Abundances and their error bars for J1222 are shown in red. Note that the abundances of Ti and V are the averages of their neutral (Ti I, V I) and ionized (Ti II, V II) species. The top panel is for the 200 non-RPE stars, while the bottom panel is for the 314 RPE stars.
Other Images in This Article
Copyright and Terms & Conditions
© 2026. The Author(s). Published by the American Astronomical Society.
Copyright ©
2026 Astronomy Image Explorer. All Rights Reserved.