Image Details
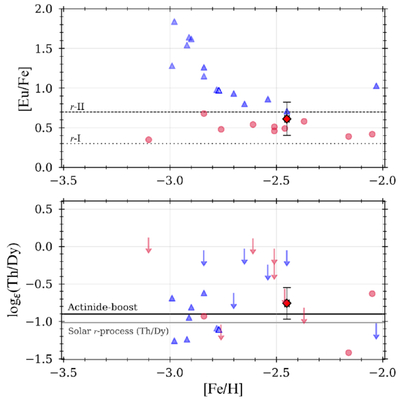
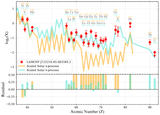
Caption: Figure 6.
Top panel: [Eu/Fe] as a function of [Fe/H] for RPE stars with available Th and Dy measurements. Red circles and blue triangles denote r-I and r-II stars, respectively. The horizontal lines indicate the r-I (+0.3 ≤ [Eu/Fe] < +0.7; dotted) and r-II ([Eu/Fe] ≥ +0.7; dashed) boundaries. J1222 is highlighted with a diamond symbol and its measurement uncertainty. Bottom panel: ﹩\mathrm{log}\epsilon ﹩ (Th/Dy) as a function of [Fe/H] for the same comparison sample. Filled symbols represent stars with detections of both Th and Dy, while arrows show upper limits in ﹩\mathrm{log}\epsilon ﹩ (Th/Dy). The horizontal line at ﹩\mathrm{log}\epsilon ﹩ (Th/Dy) > –0.9, following E. M. Holmbeck et al. (2019), indicates the actinide-boost criterion. The lower horizontal line marks the solar r-process Th/Dy ratio, ﹩\mathrm{log}\epsilon ﹩ (Th/Dy) ≈ –1.02. The comparison data are taken from the literature (S. Honda et al. 2004; A. Frebel et al. 2007; D. K. Lai et al. 2008; L. Mashonkina et al. 2010, 2014; I. U. Roederer et al. 2014; C. Siqueira Mello et al. 2014; V. M. Placco et al. 2017; E. M. Holmbeck et al. 2018; C. M. Sakari et al. 2018).
Other Images in This Article
Copyright and Terms & Conditions
© 2026. The Author(s). Published by the American Astronomical Society.