Image Details
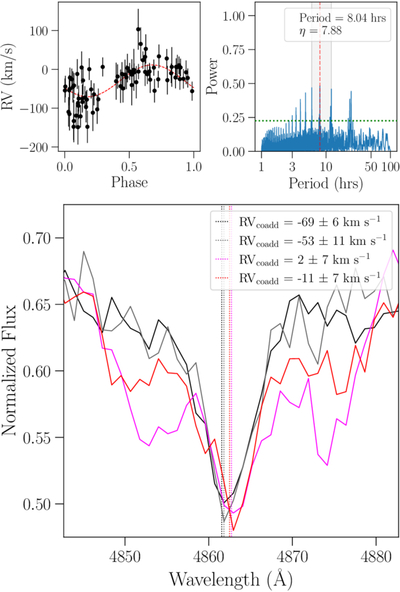
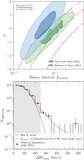
Caption: Figure 10.
Top left: RV curve of J112328.50+095619.3 phase-folded at the best-fit period of 8.04 hr. Top left: the power spectrum (blue), best-fit period (red), 5% false-alarm probability level (green), and 1σ range for the best-fit period (gray shading). Bottom: zoomed-in view of the Hβ absorption line after coadding spectra with similar phases. Spectra with similar RVs are shown with similar colors, and the expected position of the line cores using the measured RVs is shown via dotted lines. We see line depth variation over time along with a Doppler shift in the absorption lines, consistent with measured velocities.
Other Images in This Article
Show More
Copyright and Terms & Conditions
© 2026. The Author(s). Published by the American Astronomical Society.