Image Details
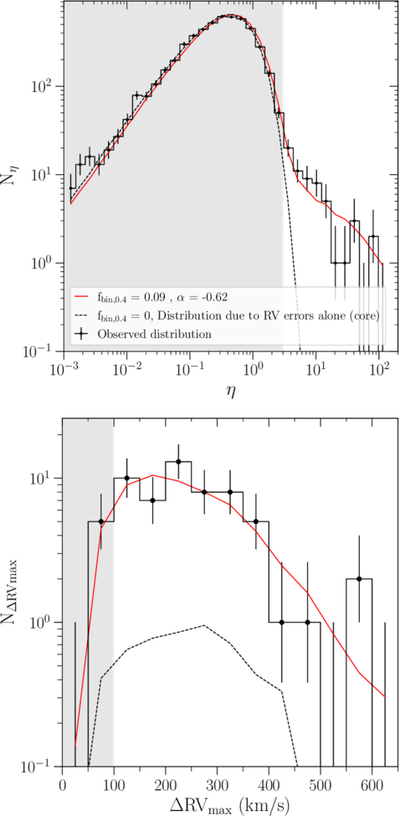
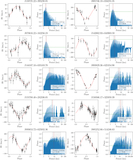
Caption: Figure 6.
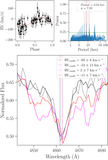
Comparison of the observed and simulated populations for the low-mass WD binary fraction of 7.5%. Top panel: the distribution of η (black) along with the best-fit model (red). The grayed-out region corresponds to η < 3, and the dashed lines correspond to the η distribution due to normally distributed RV errors with no binaries. The model agrees well with the data, despite the best fit being calculated using the ﹩{\rm{\Delta }}{{\rm{RV}}}_{{\rm{\max }}}﹩ distribution. Bottom panel: ﹩{\rm{\Delta }}{{\rm{RV}}}_{{\rm{\max }}}﹩ distribution (black) along with the best-fit model (red) for WDs with η > 3. The grayed-out region corresponds to ﹩{\rm{\Delta }}{{\rm{RV}}}_{{\rm{\max }}}\lt 100﹩ km s−1 and is not included in the fit, and the dashed lines correspond to the ﹩{\rm{\Delta }}{{\rm{RV}}}_{{\rm{\max }}}﹩ distribution due to normally distributed RV errors with no binaries. We find good agreement between the observed distribution and the model, even for data points not included in the fit.
Other Images in This Article
Show More
Copyright and Terms & Conditions
© 2026. The Author(s). Published by the American Astronomical Society.