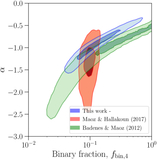
Image Details
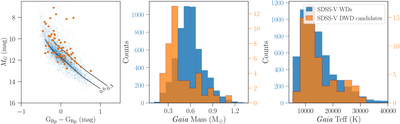
Caption: Figure 4.
Left: the Gaia color–magnitude diagram of our parent sample of WDs with hydrogen lines (blue) and DWD binary candidates (orange), with the cooling curves of a 0.3 M⊙ WD and a 0.6 M⊙ WD (A. Bédard et al. 2020). Middle: the mass distribution of the parent sample and the DWD binary candidates. Right: the temperature distribution of the parent sample and the DWD binary candidates. We use the mass and temperature of the WDs obtained using Gaia photometry (N. P. Gentile Fusillo et al. 2019, 2021).
Other Images in This Article
Show More
Copyright and Terms & Conditions
© 2026. The Author(s). Published by the American Astronomical Society.
Copyright ©
2026 Astronomy Image Explorer. All Rights Reserved.