Image Details
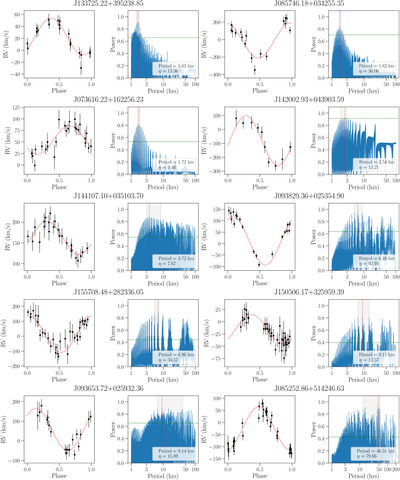
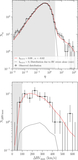
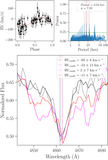
Caption: Figure 5.
The results from the Lomb–Scargle periodogram period search for WDs with large phase coverage in the RV curve. We show the best-fitting RV curve, along with the periodogram power. The best-fit period, marked with red dashed lines, is chosen where the power is at its maximum, and the 16th–84th percentile confidence interval, shown as gray shaded regions, is calculated from 5000 Monte Carlo realizations of the RV curve. For J085252.86+514246.63 we show the 2nd–97th percentile confidence interval. The green dotted lines show the periodogram power corresponding to 5% false-alarm probability.
Other Images in This Article
Show More
Copyright and Terms & Conditions
© 2026. The Author(s). Published by the American Astronomical Society.
Copyright ©
2026 Astronomy Image Explorer. All Rights Reserved.