Image Details
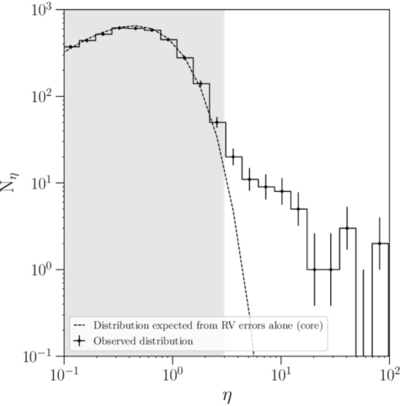
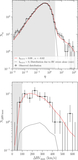
Caption: Figure 3.
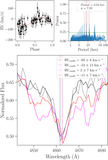
The observed distribution of RV variability parameter η. The black dashed line shows the theoretical distribution expected as a result of statistical variation from observed RV errors alone, the gray area indicates our selection cutoff, and in black we show the observed distribution. Our sample shows larger RV variability than expected, indicating the presence of binaries. The error bars for the discrete counts are drawn using the approximation for Poisson error bar upper and lower limits given by ﹩0.5\pm \sqrt{n+0.25}﹩, where n is the number of counts in a given bin.
Other Images in This Article
Show More
Copyright and Terms & Conditions
© 2026. The Author(s). Published by the American Astronomical Society.
Copyright ©
2026 Astronomy Image Explorer. All Rights Reserved.