Image Details
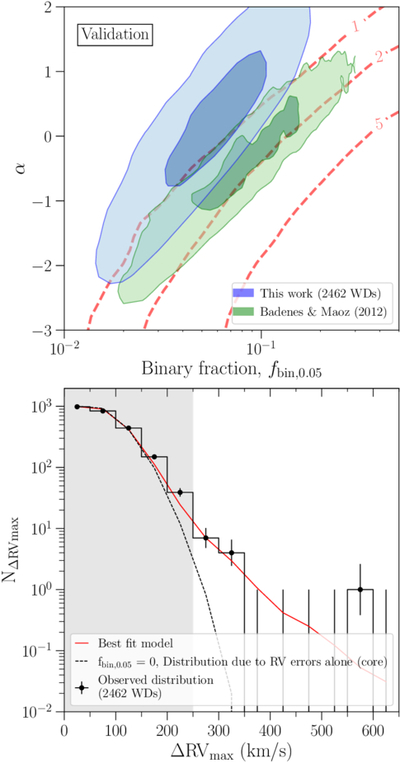
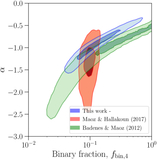
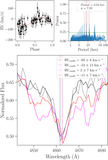
Caption: Figure 8.
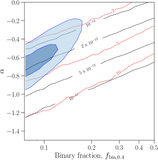
Top panel: the best-fit 1σ (darker shades) and 2σ (lighter shade) contours produced using the validation sample (G < 19 mag and RVerr < 55 km s−1), shown in blue shades, are compared with the contours from C. Badenes & D. Maoz (2012), shown in green shades. Both contours are 1σ smoothed using a Gaussian filter. The red dashed lines represent the expected number of super-Chandrasekhar-mass binaries that can merge within the age of the Universe. Bottom panel: the observed distribution of ﹩{\rm{\Delta }}{{\rm{RV}}}_{{\rm{\max }}}﹩ is compared with the model for the validation sample.
Other Images in This Article
Show More
Copyright and Terms & Conditions
© 2026. The Author(s). Published by the American Astronomical Society.
Copyright ©
2026 Astronomy Image Explorer. All Rights Reserved.