Image Details
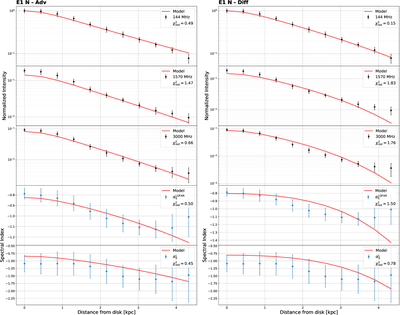
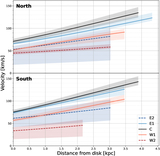
Caption: Figure 8.
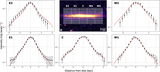
Best-fit advection (left panels) and diffusion (right panels) models in the northern part of strip E1. From top to bottom, the panels depict the SPINNAKER fits to the nonthermal LOFAR 144 MHz intensities, VLA L-band 1.57 GHz intensities, VLA S-band 3.0 GHz intensities, and the nonthermal spectral indices ﹩{\alpha }_{S}^{{\rm{LOFAR}}}﹩ and ﹩{\alpha }_{S}^{L}﹩. The red lines represent the best-fit models. The relevant parameters are listed in Table 3.
Other Images in This Article
Copyright and Terms & Conditions
© 2026. The Author(s). Published by the American Astronomical Society.
Copyright ©
2026 Astronomy Image Explorer. All Rights Reserved.