Image Details
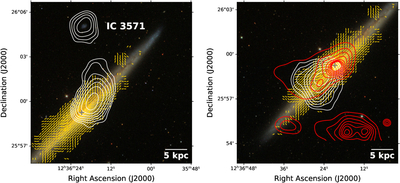
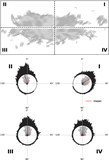
Caption: Figure 10.
Comparison of magnetic field orientations with multiphase gas structures in NGC 4565. The left panel shows the H I channel map at 1267 km s−1 (G. Heald et al. 2011), displayed as contours overlaid on the SDSS optical image. Contours start at 1 mJy beam−1 and increase by factors of two. The right panel presents the soft X-ray emission (0.5–1.5 keV; red contours), together with the H I emission at 1164 km s−1 (white contours; G. Heald et al. 2011) on the same optical background. We note that the distinct X-ray enhancement visible in the bottom-right corner is a background galaxy cluster at a redshift of ∼0.62 (E. Koulouridis et al. 2021). In both panels, magnetic field orientations are shown as yellow lines, and the galactic center is indicated by a cross.
Other Images in This Article
Copyright and Terms & Conditions
© 2026. The Author(s). Published by the American Astronomical Society.