Image Details
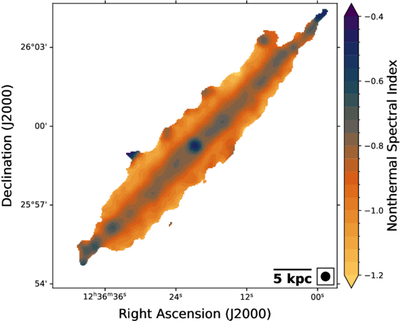
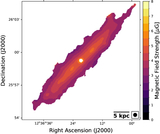
Caption: Figure 6.
Distribution of the nonthermal spectral index derived by fitting a single power law to the 144 MHz (LOFAR), 1.57 GHz (VLA L-band), and 3.0 GHz (VLA S-band) data. The map is visualized using the colormap from J. English et al. (2024). Only regions with intensities >3σ at all three frequencies are taken into account. The beam of 20″ is displayed in the bottom-right corner.
Other Images in This Article
Copyright and Terms & Conditions
© 2026. The Author(s). Published by the American Astronomical Society.
Copyright ©
2026 Astronomy Image Explorer. All Rights Reserved.