Image Details
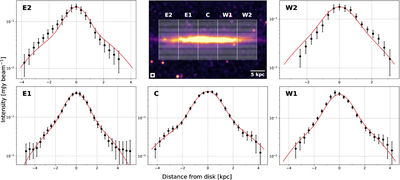
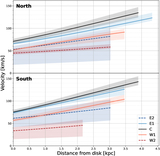
Caption: Figure 5.
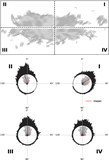
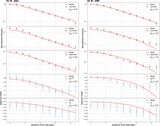
Vertical profiles of the nonthermal radio continuum emission at the S-band. The top-center panel shows the locations of the five analysis strips (E2, E1, C, W1, and W2) overlaid on the nonthermal intensity map. The other five panels display the corresponding vertical profile for each strip, arranged symmetrically around the setup panel. In each profile panel, the black points represent the measured flux density, averaged within 6″ × 120″ (0.35 × 6.92 kpc) boxes. Positive distances are to the north of the major axis, and negative distances are to the south. The red curve is the best-fit two-component Gaussian profile.
Other Images in This Article
Copyright and Terms & Conditions
© 2026. The Author(s). Published by the American Astronomical Society.