Image Details
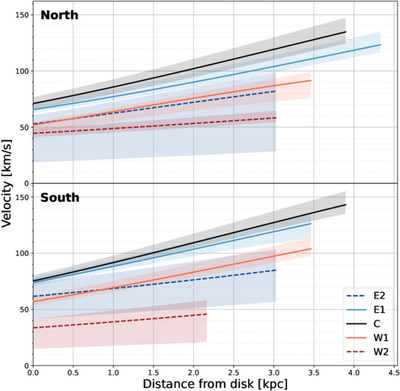
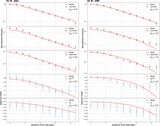
Caption: Figure 9.
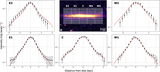
Velocity profiles derived from the advection model. The top and bottom panels display the results for the northern and southern segments, respectively. The solid (E1, C, W1) and dashed (E2, W2) lines show the best-fit solutions, while the shaded areas indicate the 1σ uncertainties.
Other Images in This Article
Copyright and Terms & Conditions
© 2026. The Author(s). Published by the American Astronomical Society.
Copyright ©
2026 Astronomy Image Explorer. All Rights Reserved.