Image Details
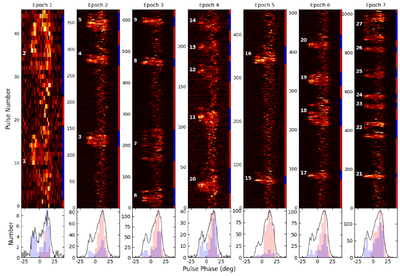
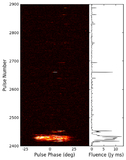
Caption: Figure 6.
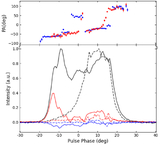
Top panel: single-pulse stack of burst pulses detected during seven observations of RRAT J1541+4703. Bottom panel: longitude distribution of single-pulse peak phases for RRAT and NP states, shown by red and blue histograms, respectively. The black curve represents the integrated pulse profile. Note that all null pulses have been removed.
Other Images in This Article
Copyright and Terms & Conditions
© 2026. The Author(s). Published by the American Astronomical Society.
Copyright ©
2026 Astronomy Image Explorer. All Rights Reserved.