Image Details
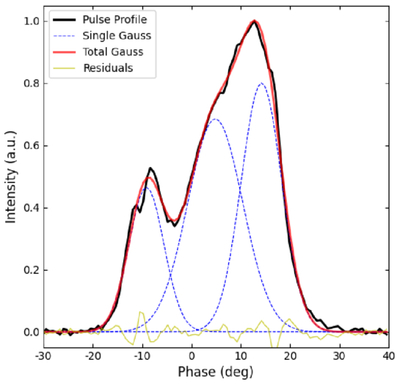
Caption: Figure 3.
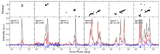
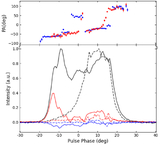
Results of the three Gaussian fits for the integrated pulse profile. The black solid line represents the integrated pulse profile, the red solid line the fitted curve, and the blue dashed line the single Gaussian component. The residuals of the fit are represented by the yellow curves.
Other Images in This Article
Copyright and Terms & Conditions
© 2026. The Author(s). Published by the American Astronomical Society.
Copyright ©
2026 Astronomy Image Explorer. All Rights Reserved.