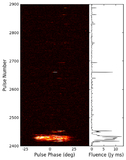
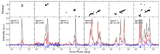
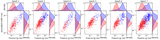
Image Details
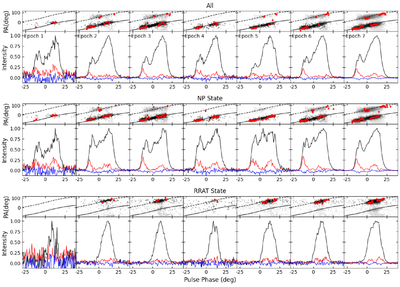
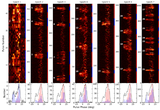
Caption: Figure 2.
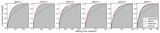
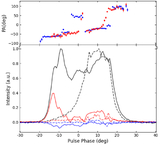
The polarized integrated pulse profile of RRAT J1541+4703 from seven epochs, including all burst pulses, NP states, and RRAT states. In the top panel of each row, red and gray dots denote the PA of the integrated pulse profile and that of a single pulse, respectively. The solid and dashed black lines indicating RVM fitting curves separated by 90∘. The corresponding bottom panel shows total intensity (black line), linear polarization (red line), and circular polarization (blue line). All pulse profiles have been normalized to peak intensity.
Other Images in This Article
Copyright and Terms & Conditions
© 2026. The Author(s). Published by the American Astronomical Society.
Copyright ©
2026 Astronomy Image Explorer. All Rights Reserved.