Image Details
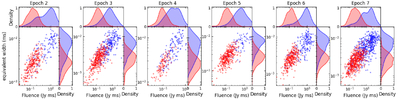
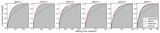
Caption: Figure 8.
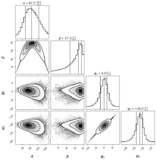
The fluence and equivalent width of RRAT J1541+4703 during Epochs 2–7. For each epoch, individual bursts are shown as a scatter plot, with the RRAT state in red and the NP state in blue. The top and right panels display the marginal density distributions for each parameter.
Other Images in This Article
Copyright and Terms & Conditions
© 2026. The Author(s). Published by the American Astronomical Society.
Copyright ©
2026 Astronomy Image Explorer. All Rights Reserved.