Image Details
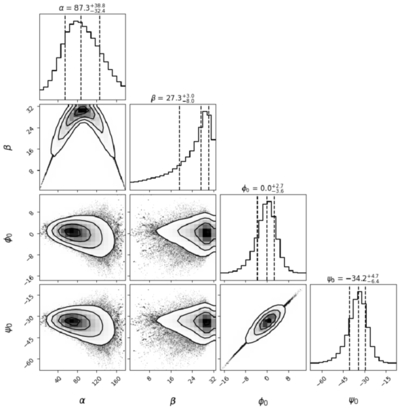
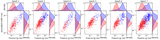
Caption: Figure 4.
An example of the posterior distributions for four parameters in RVM model fitting. The contours represent 1σ, 2σ, and 3σ confidence levels. The vertical dashed lines in the top panel of each column indicate the 16th, median, and 84th percentiles of the distribution. The fitted values and their errors for each parameter are labeled at the top of the figure in degrees.
Other Images in This Article
Copyright and Terms & Conditions
© 2026. The Author(s). Published by the American Astronomical Society.
Copyright ©
2026 Astronomy Image Explorer. All Rights Reserved.