Image Details
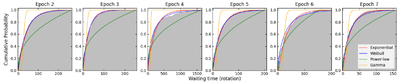
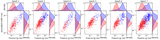
Caption: Figure 9.
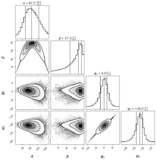
Cumulative probability distribution of single-pulse wait times for RRAT J1541+4703 from Epochs 2–7. The empirical data are compared to fits from four theoretical distributions: Weibull (red), gamma (blue), exponential (green), and power law (yellow).
Other Images in This Article
Copyright and Terms & Conditions
© 2026. The Author(s). Published by the American Astronomical Society.
Copyright ©
2026 Astronomy Image Explorer. All Rights Reserved.