Image Details
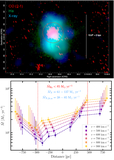
Caption: Figure 3.
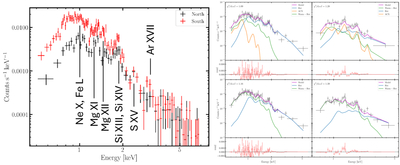
Left: combined spectra from all three observations extracted from the northern regions and the southern regions (i.e., encompassing all the three north and five south regions in Figure 2, respectively). We label the various emission lines evident in the spectra. Spectra extracted from the composite southern region from observation 19498. Top middle: the CX emission is in orange (ACX), the warm–hot thermal plasma component (APEC) is in green, and the hot thermal plasma component is in blue. The data points are in black crosses, and the residuals to the best-fit model are given below. We find that in the south, a significant portion of the broadband X-ray emission (∼38%) is dominated by CX emission. Bottom middle: same as the top middle panel, but the model does not include CX. Without CX, the model has larger residuals at soft X-ray energies and yields a statistically worse fit. Top right and bottom right: same as the middle panels, but for the composite northern region. We do not find any improvement in the fitting when using the ACX model.
Other Images in This Article
Copyright and Terms & Conditions
© 2026. The Author(s). Published by the American Astronomical Society.