Image Details
Caption: Figure 2.
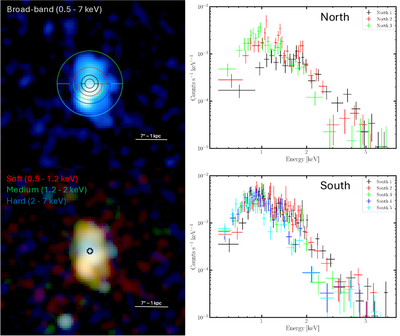
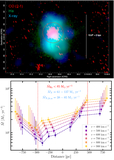
Top left: broadband (0.5–7.0 keV) X-ray image of NGC 1266 overlaid with the regions used for spectral extraction. These regions span radii between one and seven arcseconds (≈265–1013 pc) and are color coded to match the spectra shown in the right panels. At a distance of 29 Mpc, 7″ ≈ 1 kpc, as indicated by the scale bar. In these images, north is up and east is to the left. Bottom left: exposure-corrected, three-color image of NGC 1266, where red corresponds to soft (0.5–1.2 keV), green to medium (1.2–2.0 keV), and blue to hard (2.0–7.0 keV) X-ray emission. Yellow highlights soft-to-medium emission tracing the diffuse gas, while blue traces the nuclear emission as well as point sources. The AGN is marked by a cross in the three-color image. Top right: the extracted and combined spectra for each of the northern annuli, colored according to their corresponding regions shown in the top-left panel. Bottom right: same as the top right panel, but for the southern regions.
Other Images in This Article
Copyright and Terms & Conditions
© 2026. The Author(s). Published by the American Astronomical Society.