Image Details
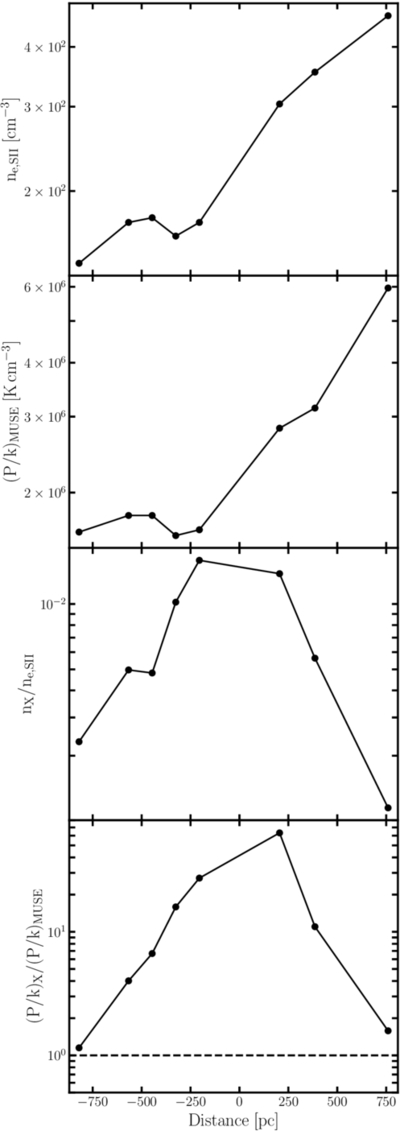
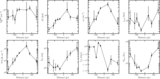
Caption: Figure 7.
First and second: gradients with distance of the median ne and P/k values from the MUSE data. Third and fourth: ratio plots comparing the ne and P/k values from MUSE and our X-ray spectral analysis. We find that the warm and hot outflow phases reach near pressure equilibrium at the outflow's maximum extent.
Other Images in This Article
Copyright and Terms & Conditions
© 2026. The Author(s). Published by the American Astronomical Society.
Copyright ©
2026 Astronomy Image Explorer. All Rights Reserved.