Image Details
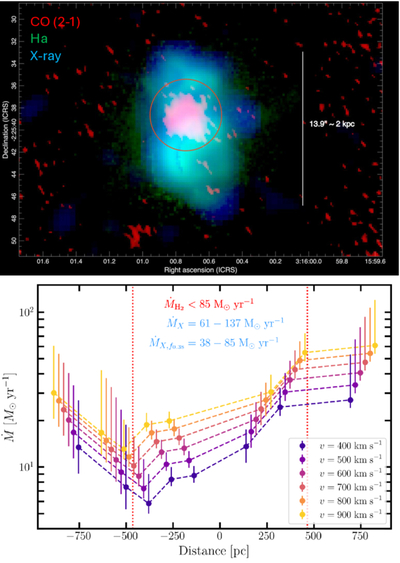
Caption: Figure 5.
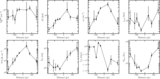
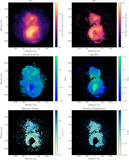
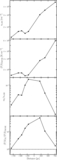
Top: three-color image of NGC 1266, where red is the SMA CO(2–1) observations from K. Alatalo et al. (2011), green is VLT/MUSE Hα, and blue is Chandra broadband X-ray emission. The red circle indicates the extent of the CO emission found in K. Alatalo et al. (2011), 3﹩\mathop{.}\limits^{\unicode{x02033}}﹩23 or ≈460 pc. Bottom: estimated hot gas mass outflow rates using the mass values in Table 3 and different velocities shown by the different colored lines, ranging from 400 to 900 km s−1, the velocities of the warm gas found by T. A. Davis et al. (2012). The vertical dotted red lines show the extent of the CO(2–1) emission along with the estimated molecular gas outflow rates, the X-ray estimated outflow rates within the same region, and the X-ray outflow rates if the filling factor were low enough to keep the hot gas mass outflow rate under the molecular gas estimate as is commonly expected (S. Veilleux et al. 2020).
Other Images in This Article
Copyright and Terms & Conditions
© 2026. The Author(s). Published by the American Astronomical Society.