Image Details
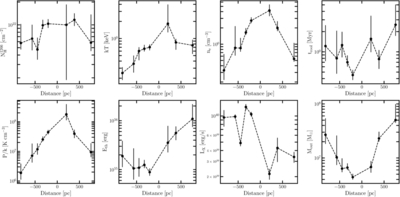
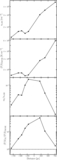
Caption: Figure 4.
Gradients of measured quantities of NGC 1266’s outflow. Top row: from the left to right, we plot the best-fit column density ﹩{N}_{{\rm{H}}}^{1266}﹩ and temperature kT, derived electron number density ne assuming spherical shell geometries for each region, and the hot gas cooling time tcool. Bottom row: from left to right, we plot the derived hot gas pressures P/k, thermal energies Eth, X-ray luminosities LX, and outflow gas mass Mout. Positive distances are north of the center, and negative distances are south.
Other Images in This Article
Copyright and Terms & Conditions
© 2026. The Author(s). Published by the American Astronomical Society.
Copyright ©
2026 Astronomy Image Explorer. All Rights Reserved.