Image Details
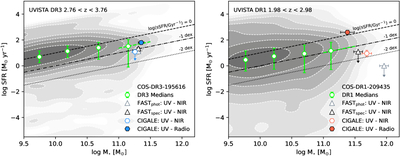
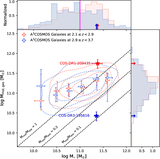
Caption: Figure 4.
The SFR–stellar mass plane showing COS-DR3-195616 (left panel) and COS-DR1-209435 (right panel). The population of galaxies in the UltraVISTA DR3 (DR1) catalog within a redshift range of zspec ± 0.5 of each UMG is indicated by the gray contours. The green symbols show the median SFR in bins of 0.5 dex in stellar mass, with error bars representing the 16th and 84th percentiles of the distribution of SFR among galaxies in each bin. The median sSFR of the highest-mass bin is shown as a dashed green line with ﹩{\mathrm{log}}﹩(sSFR/Gyr−1) ∼ − 0.64 (−0.99) for the DR3 (DR1) population. The open gray and black triangles show the FAST+ + fits the UV-NIR SEDs at the photometric and spectroscopic redshifts, respectively. The open and filled blue and red hexagons show the CIGALE fits the UV-NIR and UV-radio SEDs, respectively, at the spectroscopic redshifts (see Section 4 and Tables 2 and 3).
Other Images in This Article
Copyright and Terms & Conditions
© 2026. The Author(s). Published by the American Astronomical Society.