Image Details
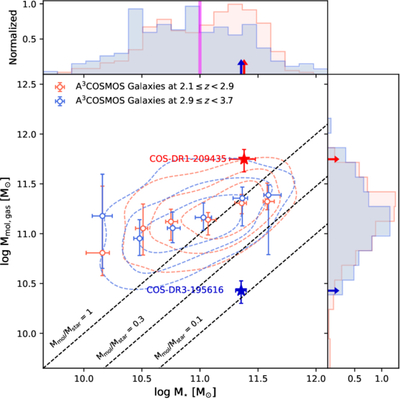
Caption: Figure 5.
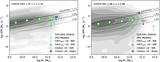
Molecular gas mass versus stellar mass with 195616 (209435) shown by the solid blue (red) star. The top and right panels show the normalized histogram of stellar mass and molecular gas mass, respectively, for A3COSMOS galaxies in the redshift range 2.1 ≤ z < 2.9 (red) and 2.9 ≤ z < 3.7 (blue). The colored contours enclose 25%, 50%, and 75% of the galaxy population, showing the 2D density distributions for A3COSMOS catalog in each redshift range, constructed using kernel density estimation (KDE). The open colored circles show medians, with 3σ bootstrap uncertainties. The dashed black lines show gas-to-stellar-mass ratios of 0.1, 0.3, and 1. The magenta vertical line in the top panel shows the lower mass limit (﹩{\mathrm{log}}({M}_{\star }/{M}_{\odot })﹩ > 11) used to make Figure 6.
Other Images in This Article
Copyright and Terms & Conditions
© 2026. The Author(s). Published by the American Astronomical Society.