Image Details
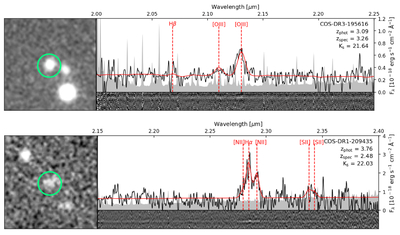
Caption: Figure 2.
Ks-band images (left panels) and MOSFIRE 1D and 2D K-band spectra (right panels) for COS-DR3-195616 (upper) and COS-DR1-209435 (lower). The black solid lines show the observed 1D spectra. The gray shading shows the magnitude of the error spectrum. The solid red lines show the best-fit models from FAST++ described in Section 3.3. The green circles are drawn with a 2″ diameter. Red vertical dashed lines indicate the location of prominent emission lines. The y-axis shows flux density in units of 10−18 erg s−1 cm−2 Å−1, plotted from zero with a dash indicating one unit.
Other Images in This Article
Copyright and Terms & Conditions
© 2026. The Author(s). Published by the American Astronomical Society.
Copyright ©
2026 Astronomy Image Explorer. All Rights Reserved.