Image Details
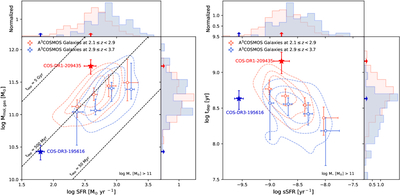
Caption: Figure 6.
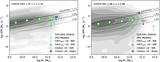
Molecular gas mass as a function of SFR (left panel) and depletion timescale as a function of specific SFR (right panel). The symbols are the same as in Figure 5, but note that only A3COSMOS galaxies with a stellar mass of ﹩{\mathrm{log}}({M}_{\star }/{M}_{\odot })﹩ > 11 were used to make this figure (see Table 5). The dashed black lines in the left panel correspond to gas depletion timescales of 50 Myr, 500 Myr, and 5 Gyr.
Other Images in This Article
Copyright and Terms & Conditions
© 2026. The Author(s). Published by the American Astronomical Society.
Copyright ©
2026 Astronomy Image Explorer. All Rights Reserved.