Image Details
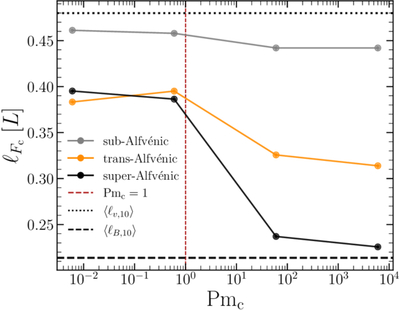
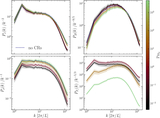
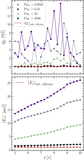
Caption: Figure 8.
Measured correlation scales (Equation (20)) for CR flux as a function of microphysical diffusion, Pmc. We show the isotropic correlation lengths with the color indicating the ﹩{{ \mathcal M }}_{{\rm{A}}0}﹩ value of the simulation. We show a vertical line at Pmc = 1 ⇔ Dc = Dcrit and two horizontal lines indicating the mean values of ℓv and ℓB for the super-Alfvénic runs.
Other Images in This Article
Show More
Copyright and Terms & Conditions
© 2026. The Author(s). Published by the American Astronomical Society.
Copyright ©
2026 Astronomy Image Explorer. All Rights Reserved.