Image Details
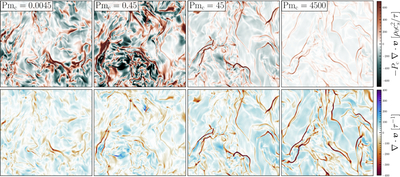
Caption: Figure 10.
Two-dimensional slice visualizations through the plane perpendicular to B0, for the full suite of ﹩{{ \mathcal M }}_{{\rm{A}}0}\approx 10﹩, super-Alfvénic simulations at t = 5τ. The columns show increasing levels of Pmc, and the rows show −Pc∇ · v (top) and ∇ · v (bottom). The regions in the plasma that contribute to the CR heating (Equation (24)) are coherent structures where the flow is strongly converging (∇ · v < 0).
Other Images in This Article
Show More
Copyright and Terms & Conditions
© 2026. The Author(s). Published by the American Astronomical Society.
Copyright ©
2026 Astronomy Image Explorer. All Rights Reserved.