Image Details
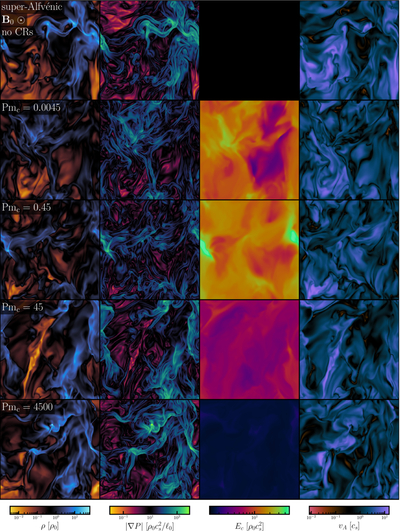
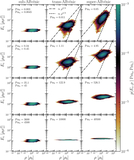
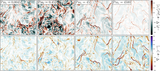
Caption: Figure 2.
Two-dimensional slice plots through the perpendicular plane to the mean magnetic field, B0, for the full suite of ﹩{{ \mathcal M }}_{{\rm{A}}0}\approx 10﹩, super-Alfvénic simulations, showing the plasma density, total plasma pressure gradient magnitude, CR energy density, and Alfvén velocity magnitude from left to right. Descending rows show increasing microphysical diffusion compared to the background turbulent diffusion, parameterized by Pmc. The top row shows the pure MHD simulation (no CR fluid). We note that we keep all color bars identical between columns, with all the quantities normalized using the thermal units of the plasma. In both the top row and the bottom row the spatial distribution of Ec is uniform, i.e., ﹩{E}_{{\rm{c}}}\approx {\rho }_{0}{c}_{s}^{2}﹩, which we discuss further in Section 5.
Other Images in This Article
Show More
Copyright and Terms & Conditions
© 2026. The Author(s). Published by the American Astronomical Society.