Image Details
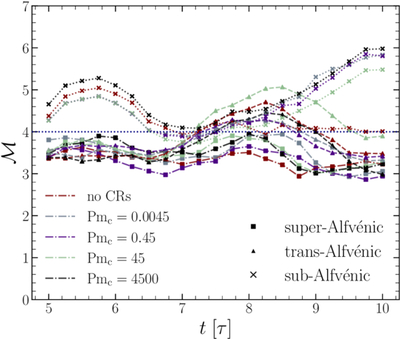
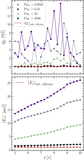
Caption: Figure 1.
Turbulent Mach number, ﹩{ \mathcal M }﹩, plotted as a function of time, t/τ, for all simulation runs. The ﹩{ \mathcal M }﹩ values are mass-weighted and averaged over volume. The different ﹩{{ \mathcal M }}_{{\rm{A}}0}﹩ regimes are indicated by the markers, with the value of the ratio between the microphysical diffusion coefficient and the turbulence diffusion coefficient Pmcr (see Equation (15)) indicated with the color. We show results for the last 5τ of our simulation. This allows all simulations to reach a statistically stationary state (J. R. Beattie et al. 2022c) with ﹩{ \mathcal M }\approx 4﹩. All statistics in the study will be averaged over multiple realizations across the 5τ ≤ t ≤ 10τ interval shown in this plot. Note that we drive with exactly the same momentum flux injection, so there is some scatter between the simulations with different magnetic field strengths (Alfvénic state of the turbulence, shown with the marker). See Table 2 for a list all of the averaged ﹩{ \mathcal M }﹩.
Other Images in This Article
Show More
Copyright and Terms & Conditions
© 2026. The Author(s). Published by the American Astronomical Society.