Image Details
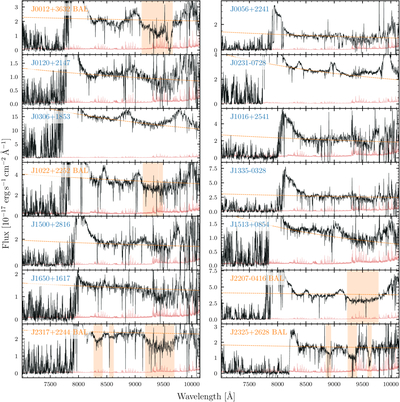
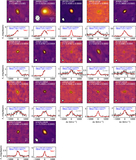
Caption: Figure A2.
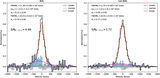
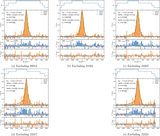
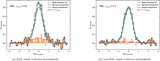
Keck/ESI rest-frame UV spectra of the quasar sample. Black and red colors plot the flux and corresponding error array, respectively. BAL quasars (BI0 > 1000 km s−1) are labeled with orange text, and regions shaded in orange highlight prominent BAL absorption troughs. The dashed curves indicate the power-law continuum fits used to normalize the spectra. The spectra are available in CSV format at doi:10.5281/zenodo.18677316.
Other Images in This Article
Copyright and Terms & Conditions
© 2026. The Author(s). Published by the American Astronomical Society.
Copyright ©
2026 Astronomy Image Explorer. All Rights Reserved.