Image Details
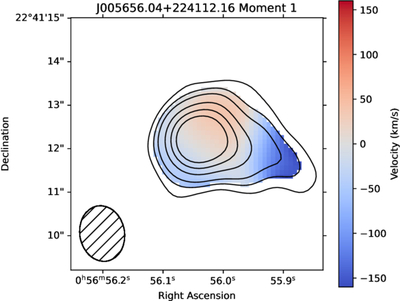
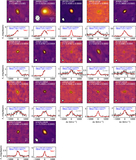
Caption: Figure 7.
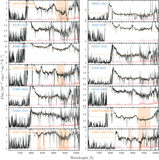
The moment 1 (velocity) map of J0056+2241 relative to its systemic redshift of z = 5.5218. The contours represent significance levels of (2σ, 3σ, 4σ, 6σ, 8σ, and 10σ) from the moment 0 map. The map reveals blueshifted emission within the extended [C II] structure although the velocity remains within the FWHM of its emission line profile, as shown in Figure A1.
Other Images in This Article
Copyright and Terms & Conditions
© 2026. The Author(s). Published by the American Astronomical Society.
Copyright ©
2026 Astronomy Image Explorer. All Rights Reserved.