Image Details
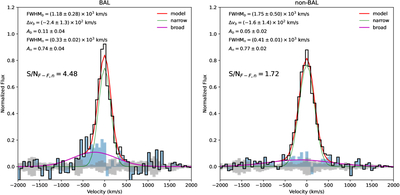
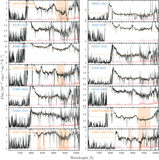
Caption: Figure 4.
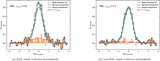
[C II] emission from the stacked image cubes of BAL (left panel) and non-BAL (right panel) quasars. The black curves represent the normalized flux (arbitrary units), while the blue shaded regions show the residual flux after subtracting the narrow component. The gray shaded regions indicate the ±1σ noise level. The fitting parameter uncertainties shown in this plot are derived from a single stack, rather than the bootstrap approach used in Figure 1. When stacking image cubes instead of 1D spectra, the BAL sample still exhibits a significant broad component at 4.48σ, whereas the non-BAL sample remains below the 2σ detection threshold.
Other Images in This Article
Copyright and Terms & Conditions
© 2026. The Author(s). Published by the American Astronomical Society.